Build Customer Cohort Analyses with AI
Turn messy customer data into clean cohort tables, retention curves, and revenue waterfalls. Compound does the segmentation, pivoting, and formatting — you review the output.

Trusted by 1,000+ finance professionals across PE, VC, growth equity, real estate, and hedge funds.
How It Works
Upload customer data
Drop in raw customer data — transaction logs, CRM exports, subscription records — in Excel or CSV format.
Define your cuts
Tell Compound how to segment: by signup month, plan tier, geography, deal size, or any dimension in your data.
Get cohort models
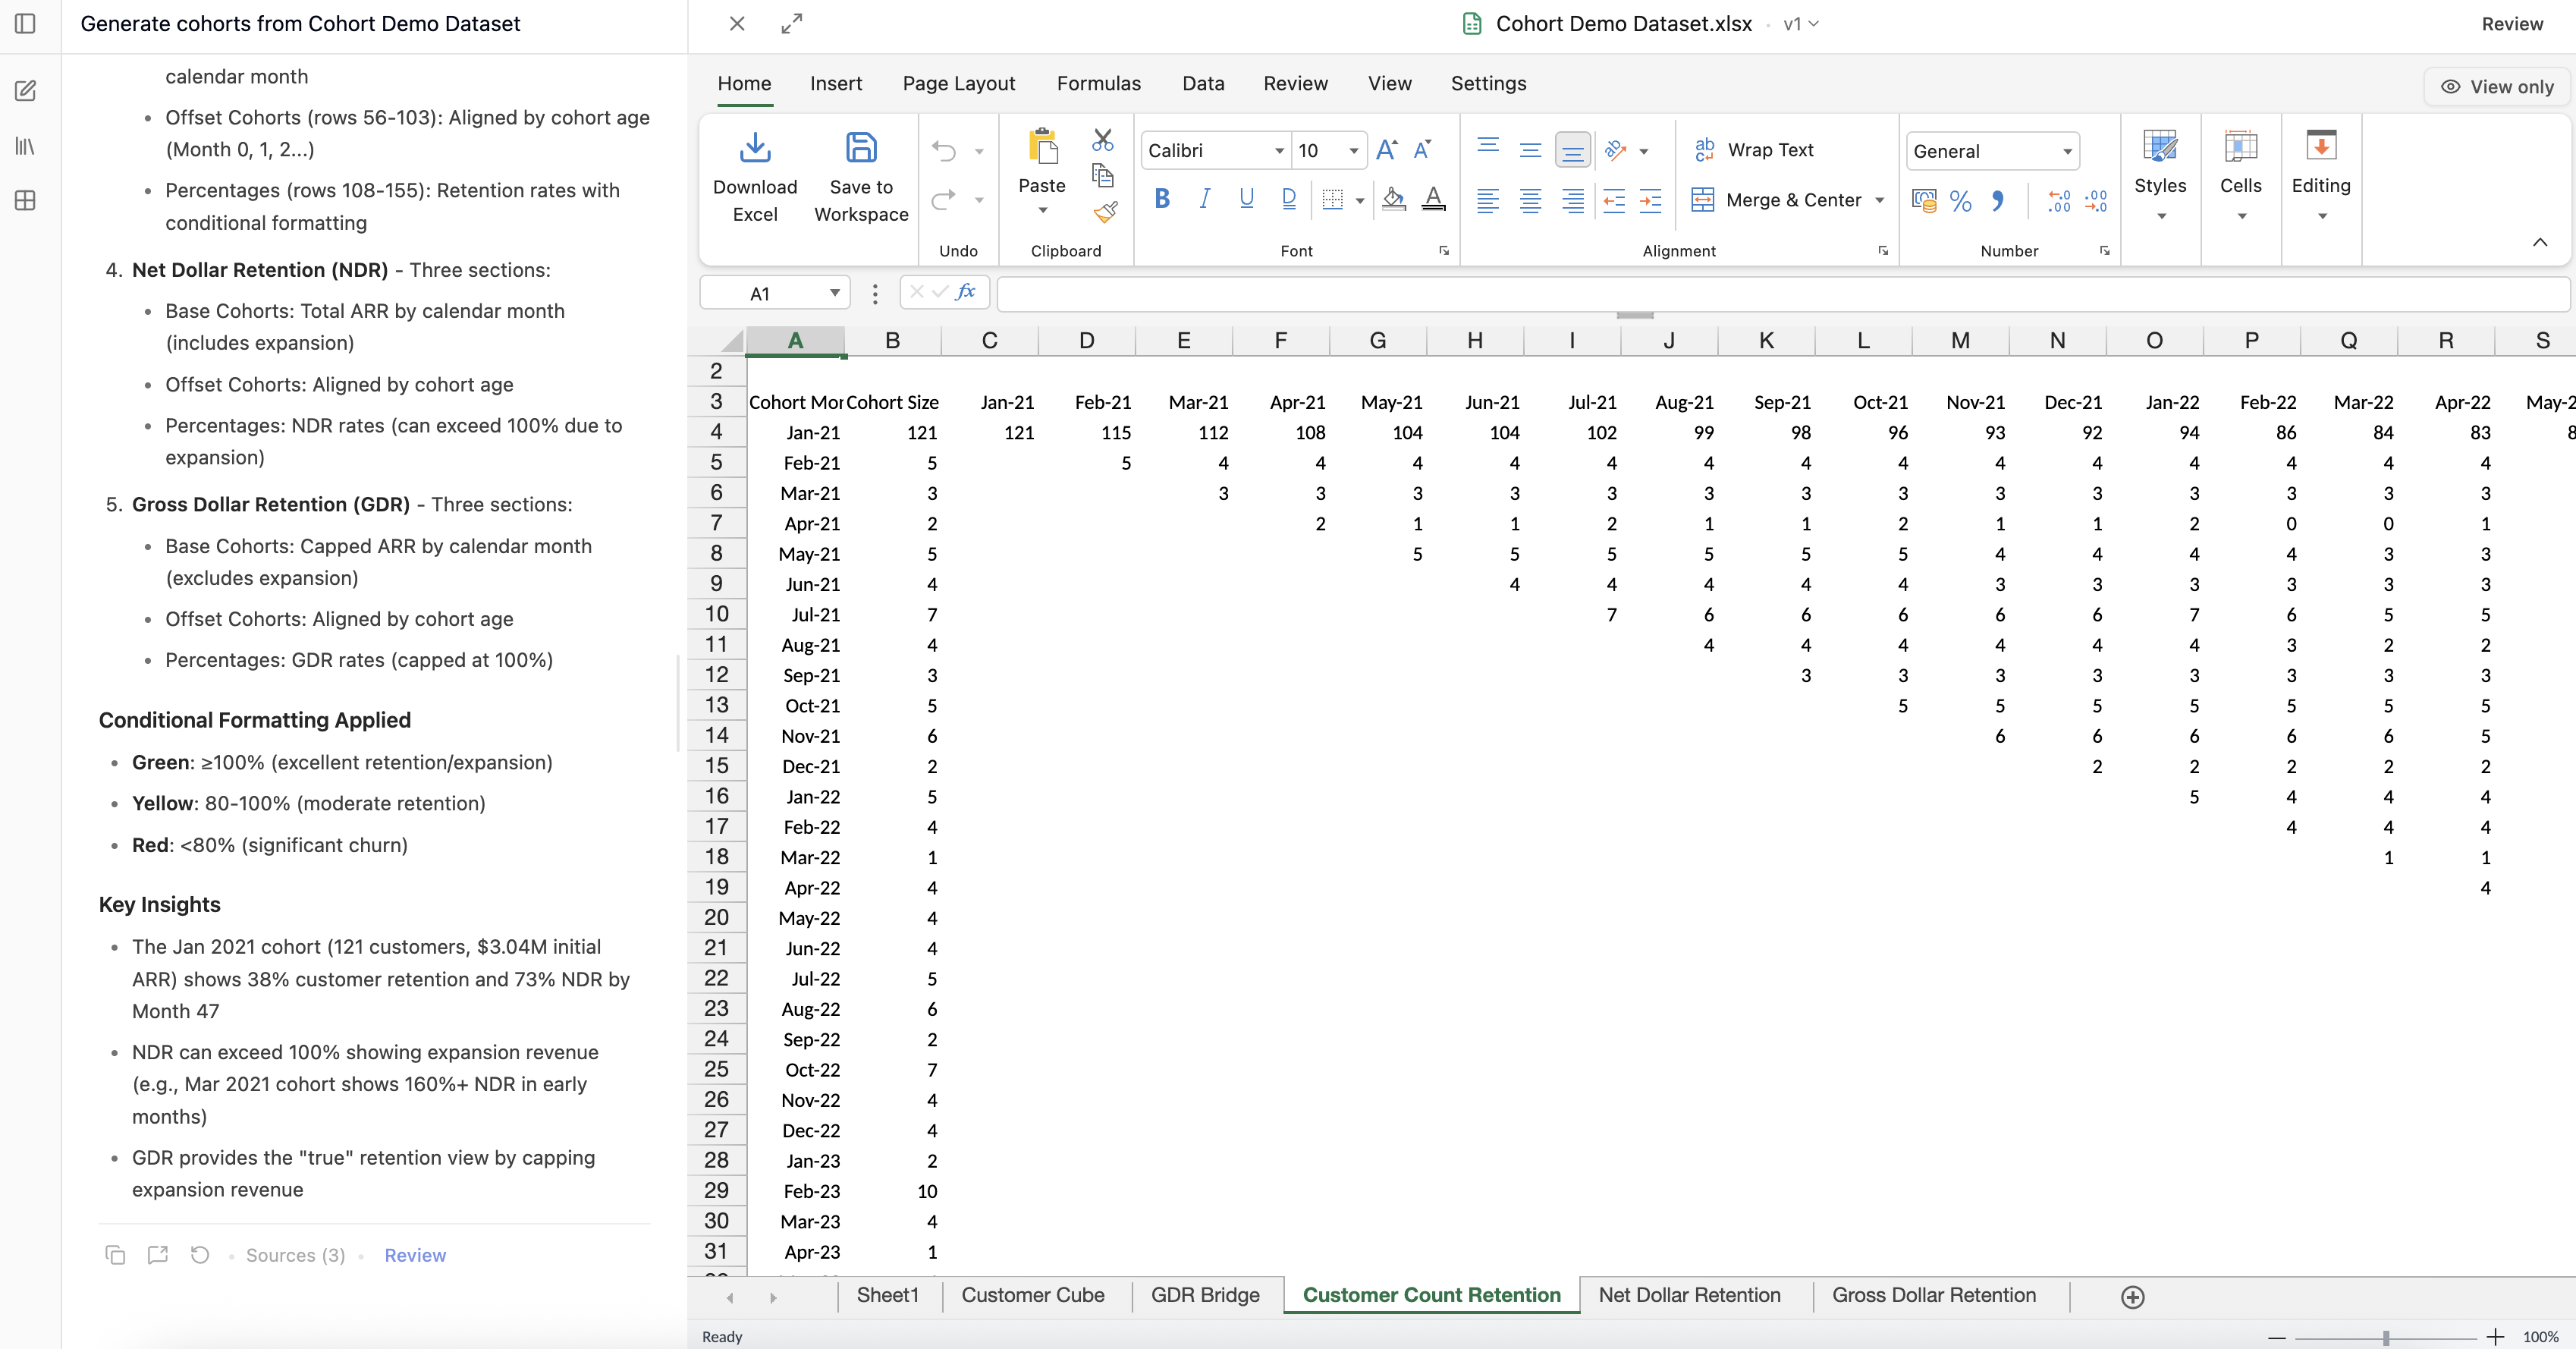
Receive structured Excel workbooks with cohort retention tables, revenue waterfall charts, and churn analysis — complete with formulas.
Why Compound Excels
Any segmentation
Cut data by any dimension — time, geography, plan, deal size, acquisition channel — just describe what you need in plain English.
Formula-native output
Cohort tables come with real Excel formulas, so you can tweak assumptions, extend the analysis, and audit every calculation.
Iterative refinement
Ask follow-up questions to adjust segments, add new cuts, or drill into anomalies — all in the same conversation thread.
Upload your customer data and get cohort tables in minutes
Frequently Asked Questions
Compound accepts Excel files (.xlsx, .csv, .tsv) and can read customer data from PDFs or other documents. The AI understands common data structures and can clean messy datasets.
Yes. Tell Compound how you want to segment — by month, quarter, geography, plan tier, deal size, or any column in your data. You can also ask for multi-dimensional cuts.
Compound generates cohort retention tables with proper Excel formulas, and can create visual retention curves as charts within the workbook.
Absolutely. Ask follow-up questions to refine segments, add new dimensions, exclude outliers, or drill into a specific cohort — all within the same conversation.